
Suppose you are the ML expert among a team of healthcare professionals. The project they are working on is to determine the life expectancy of patients. This would help them in downstream tasks. One of these healthcare professionals suggests that you can use Linear Regression. Is this approach appropriate here?
For this answer, it is clear that Linear Regression would be appropriate since we are predicting a continuous value (i.e. age that a person will live until).
Strong Candidate:
To confirm that linear regression is really appropriate, it must follow these 4 assumptions:
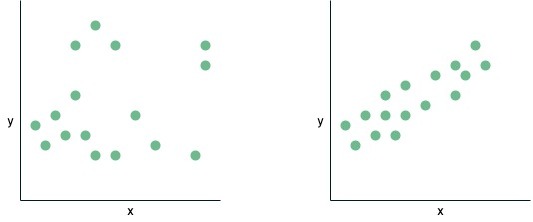
1. Linearity: this means that the relationship must be linear between the independent variables and dependent variables. For example, if we take a look at the left diagram below we see that there is no linear relationship between \(x\) and \(y\), however, looking at the plot on the right, there is a clear linear relationship between x and y. Note, an equation like \(y = \beta_0 + \beta_1 \log(x) + \beta_2 cos(x)\) also satisfies this relationship as we can rewrite this equation to \(y = \beta_0 + \beta_1 x_1+ \beta_2 x_2\) where \(x_1 = \log(x)\) and \(x_2= cos(x) \), which looks like a normal linear equation. This means that once the coefficients are linear it will satisfy linearity.
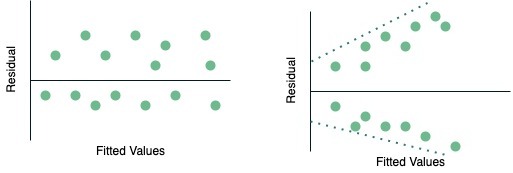
2. Homoscedasticity: refers to a situation in which the residuals or errors of a statistical model exhibit constant variance across the range of predictor variables. Look at the diagram below, the image on the left shows a plot of constant variance of the residuals (homoscedasticity) while the image on the right is a plot showing heteroscedasticity. You can see that as the fitted value increases, the residuals spread out more, this is a classic sign of heteroscedasticity.
3. Independence: independent variables (observations) are not highly correlated, in other words, they are independent of each other.
4. Normality: refers to the characteristic of a statistical distribution in which the observations or data points cluster around the mean, and the shape of the distribution follows a symmetrical bell curve. This property holds true for any fixed value of the observations, indicating that the data tends to be well-distributed around the mean, forming a typical Gaussian or normal distribution.
Follow Up 1: Suppose the features you get access to are: year a person was born, BMI, country at birth, units of alcohol consumed per week and nationality at birth. However, there is a problem with these features, what is it?
Typically when you get a question about what could be the problem, you should always think about answering the question in two parts. First, you should identify the issue and then provide ways to solve the problem (this second part shows that you are a strong candidate).
The problem is that there exists collinearity between country at birth and nationality at birth. This means that they are highly correlated: the country at birth can predict nationality at birth and vice versa. This becomes a problem because we lose interpretability as we would not be able to distinguish between individual effects of the two co-linear variables and it violates one of the assumptions of linear regression (independence).
Strong Candidate:
We can identify collinearity by using Variance Inflation Factors (VIF). VIF gives a score to each independent variable and this score indicates how well it is explained by other independent variables. A score above 5 is usually considered to indicate collinearity. We can generally solve collinearity by either removing one of the features or linearly combine both features. Since both are categorical values, removing the country at birth or nationality at birth would be the best option.
Follow Up 2: What is the difference between correlation and covariance?
Covariance is a measures the extent two features either increase or decrease with each other (range \((-\infty, \infty)\)). A covariance score of 0 indicates that both features are not related. If the covariance score is positive it means that both features increase in the same direction and a negative score indicates an inverse relationship between the two features.
On the other hand, correlation lets us know the strength and direction of the two features (range \((-1, 1)\)). If we say two features are correlated, then we can say that a change in one feature creates an impact/change in another variable. A positive correlation indicates that as one feature increases the other will increase, a correlation score of 0 indicates no relationship between variables and a negative correlation indicates that as one feature increases the other will decrease.
Strong Candidate:
A Covariance matrix is used in PCA, Gaussian mixture models (GMMs) and Mahalanobis Distance.
Correlation can be used to find patterns in large amounts of data.
Follow Up 3: Which metric would you choose for this problem? Are there alternatives?
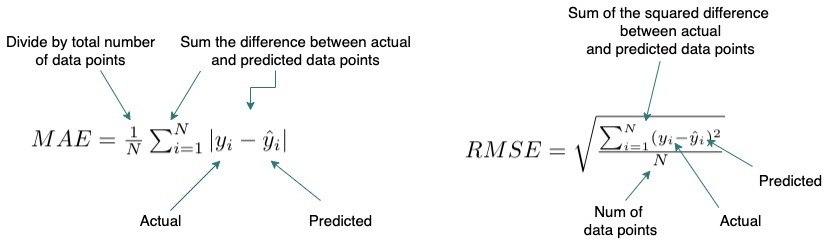
To answer this question we should define a few regression metrics, in our case, we will use the two most popular Root Mean Square Error (RMSE) and Mean Absolute Error (MAE). Then state why we would use one over the other.
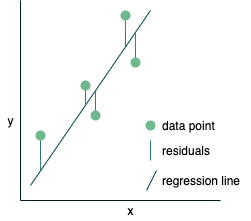
RMSE: calculates the average of the squared difference between the predicted and actual values. Thus, larger errors (outliers or poor prediction) are flagged more than when using MAE due to squaring errors.
MAE: calculates the average of the absolute difference between the predicted and actual values. As a result, it does not punish large errors as much as RMSE.
If we have outliers or want to ignore them then using MAE would be suitable since it is more robust to outliers, however, its derivate is not continuous at 0 whereas RMSE is differentiable so you can use it in conjunction with optimization methods such as gradient descent. In this situation, if we assume that there are not many outliers then we can use RMSE as our metric.
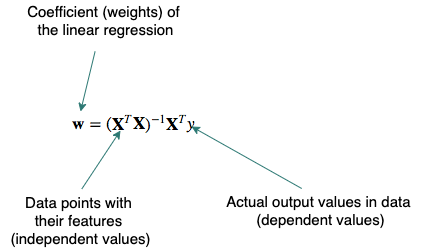
Follow Up 4: What are the two methods to solve Linear Regression?
Linear regression is a popular method so you should be familiar with the closed-form solution to this problem. As with other ML methods, an optimization technique would also solve the model.
- Closed-form equation: we can use linear algebra to calculate the weights (coefficients) directly:
- Optimization algorithm, typically Gradient Descent (GD) or Stochastic Gradient Descent (SGD): the weights are updated incrementally by first calculating the loss function, then calculate the gradient with respect to each weight and shift each weight in the opposite direction (descent) to the gradient.
- Strong Candidate: When giving multiple examples it is usually a good idea to state the pros and cons for each.
- The closed-form solution guarantees the optimal solution however due to the matrix inversion this becomes computationally expensive with large datasets. Also, if the inverse does not exist it is better to use SGD but there are no guarantees that the solution you get is optimal.
Follow Up 5: You mentioned to solve Linear Regression we can use optimization techniques. Should we use Gradient Descent or Stochastic Gradient Descent?
Again, when asking what to use in a question, we should always define and then give the pros and the cons thus, arriving at a conclusion. In this case, the main difference between using these two methods would be the size of the dataset. Since we are not given the size of the dataset we should ask. For this answer, let us assume that the interviewer said millions of data points.
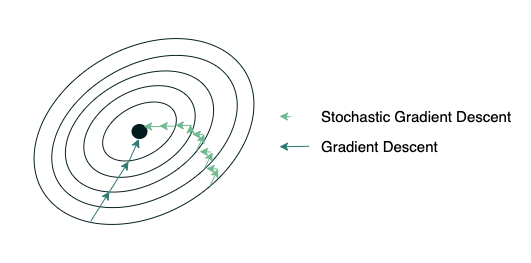
Both GD and SGD iteratively update the weights to minimize the error function. The main difference is how they approach this update. In GD we pass through the entire dataset before we update the weights. In SGD, we (in the strictest definition) use only one data point and then updates the weights, however, this is very noisy so we generally update the weights using a subset of the data, this is sometimes called Mini-batch Gradient Descent (MGD). Thus, you would tend to use SGD/MGD when the dataset is very large since it converges faster than GD, however, GD usually gets to a better minimum than SGD. In this problem, since we have a large dataset size we would use SGD/MGD.
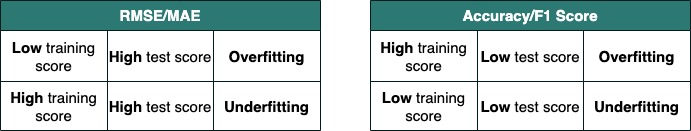
Your colleague is creating a polynomial linear regression model with thousands of features and she got a training RMSE is 0.2 and a test RMSE is 100.5. Why is there this discrepancy?
In most questions that you see online for overfitting, we use the metric accuracy and so the training accuracy is high usually close to 100% and the testing is poor (~60%). This question uses RMSE as the metric and thus a smaller value indicates better performance.
Since the training RMSE is very low (i.e. accurate) while the test RMSE is very high there seems to be the issue of overfitting. In overfitting, the model almost “memorizes” the training data and so is very accurate (almost perfect) on the training data but this comes at the price of generalization, i.e., the model is only good at predicting the training data and any data that is different it would perform poorly on. The polynomial model may be too complex for this dataset (high degree polynomials).
Below we have two tables to help you remember when a model is overfitting depending on the metrics the interviewer gave you.
Strong Candidate:
In order to prevent this from happening we can take the following actions:
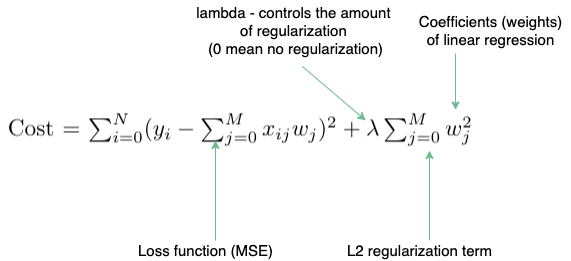
- Regularization: will reduce overfitting by penalizing the large coefficients which would lead to generalization.
- Train with more data: by having more data the model can better detect the signal and it reduces the chances of the model memorizing the data.
- Cross-Validation: split the data into k groups and let one group be the validation set while the others are used for training the model (we interchange which group becomes the validation set).
- Reduce the number of features: We can use some feature selection methods – filter-based (chi-square), wrapper based (Recursive Feature Elimination) or embedded like Lasso regularization.
- Change the model for e.g. ensemble learning techniques: by having multiple weak models instead of one model, we hope to capture the signal in the data better and so we can generalize to unseen datasets.
Follow Up 1: One way to prevent overfitting is regularization as you have mentioned. What are good regularization methods that can be applied to your colleague’s model?
The two most popular regularization techniques for linear regression models are:
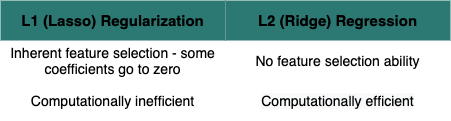
Lasso (L1 regularization): we add an additional term to the cost function which calculates the sum of absolute values of the coefficients
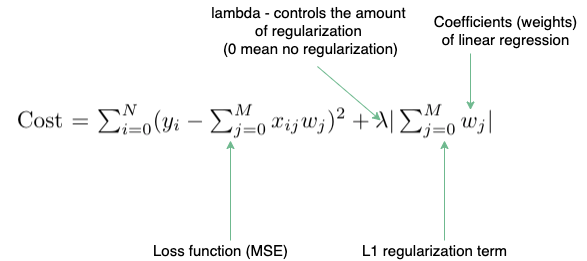
Ridge (L2 regularization): we add an additional term to the cost function which calculates the sum of squares of the coefficients
Strong Candidate:
One of the differences between the two is that Lasso has “built-in” feature selection since it shrinks the least important features’ coefficient to zero, creating sparse outputs. However, ridge regression is more computationally efficient due to being differentiable at 0 (can be used easily with gradient descent) while lasso is undefined at 0.
In this scenario, it would be better to use Lasso since it reduces the features space as all the 1000+ features may not be relevant.
Follow Up 2: What if we wanted to use L1 and L2 regularization together in your colleague’s model?
Yes, in fact, there is a name for this type of regularization, it is called elastic-net. We can control the combination of lasso and ridge regression by including a ratio parameter. By using elastic-net we are able to gain some of ridge’s stability while having the feature selection part of lasso.
Follow Up 3: Now that we have a model that is performing well, how can we interpret the coefficients?
If the features are normalized then the coefficients are an indication of feature importance, i.e. features with higher coefficients are more useful for prediction.
Follow Up 4: After speaking with your colleague, she mentions that she needs to think about the bias-variance tradeoff. Why?
This is a very classic problem and you should be very familiar with this answer. I have included a diagram, which you can draw in the interview if it would help you.
Bias is the difference between the predicted value and the actual value, in order words, it is the error that is created when you try to approximate the actual function. Thus, when you have a high bias it means that the difference between the predicted and actual is very different which means you are underfitting the data. When you start to increase the complexity of your model, the model performance begins to increase (bias decreases and variance increases). Variance is the sensitivity of the model to new data. If you continue to increase the model complexity, the model is able to perform exceedingly well on the training data but it cannot generalize to new data. Thus, it is said that your model is over-fitting the data.
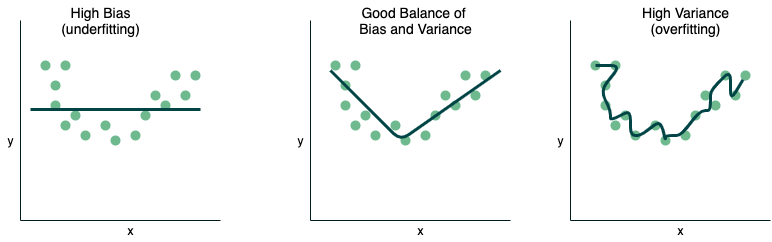
The Bias-variance tradeoff is the relationship between bias and variance as you try to minimize each but by minimizing one the other increases, so there is inherently a tradeoff. The equation is:
\(\text{Expected Test Error} = \text{Variance} + \text{Bias}^2 + \text{IrreducibleError}\)