
This template will guide you through almost any ML system design question that you receive. It is important to note that this template is intentionally generic so that when you find a new system design question, it is easy to fill in each section.
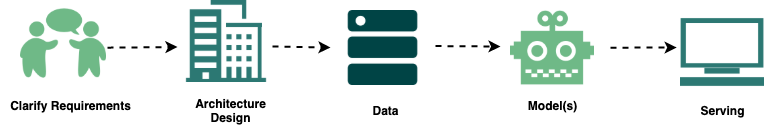
Below is an overview of the steps you should take when you have an ML System Design interview:
When you have to do an ML Design interview, the two areas to focus on is Data and Modelling. This is because the general thrust of ML Design interviews is to understand your thought process when faced with an (almost) real-world problem and data collection/preprocessing, as well as the model you will choose, will be core components of what you will build. Hence, you should focus on these areas the most in the interview.
Clarifying Requirements

The first thing that you should do when given a question is to clarify the requirements. For example, your question could be “Design a system that recommends our products to users who have a profile.” Most ML system design questions are intentionally vague so that you would ask further questions in order to understand the scope and what components you should focus on.
After the interviewer gives you the prompt, reword the prompt into your own words. This ensures that you and the interviewer are on the same page and that you will answer the correct question.
Then, you can begin to think about how this system will affect the user experience. For the prompt above, we can ask questions such as:
- How will the user view the recommendations? Is it after they have clicked an item, on their home page etc.?
- What is the current user experience? Do users have any recommendations currently?
- Can users interact with the recommendation (maybe favourite or block the recommendation)?
These questions will give you a better understanding of the customer experience as well as what the business wants to gain from this system which will guide you when thinking about online metrics.
Next, we can begin to get into clarifying the scope of this problem:
- Scale of the problem: How much data would we have access to? How many users are on the platform? [for smaller datasets less complex models would be more appropriate but for bigger datasets, larger models like deep neural networks would work]
- Hardware Constraints: How much time do we have to complete the task? How much compute power is available? Do we have access to GPUs or TPUs? [if we are limited on hardware size, then we should use simpler models]
- Model Constraints: Do we need a model that is quick to respond to a request or do we need a model that is extremely accurate? Does this systems apply to all user segments? How quickly do items get stale (this gives us an idea about how often we need to retrain our model)? Would the model need to be interpretable? Should we build one model for all user segments (like countries) or should we build multiple models?
You should have written those answers down on the whiteboard (or the online platform/doc if you are doing the interview virtually). Please note that depending on the use case some questions may not be relevant, so you do not need to ask all the questions.
Metrics
Now that you have a clear idea of the use case and asked a few clarifying questions, you can use this information to determine the best metric(s) to use when modelling. You should always give at least two metrics: one for offline and one for online.
Offline metrics are those we used to score the model when we are building it. This is before it is put into production and shown to users. This is the typical scenario in research or tutorials where you split your dataset into three sets train, eval, and test. Some examples of these offline metrics are AUC, F1, \(R^2\), MSE.
Online metrics are the scores we get from the model once it is in production serving requests. Online metrics could be the click-through rate or how long the users spends watching a video that was recommended. These metrics are use case-specific. You need to think about how a company would evaluate whether the model was useful to the users once it is in production.
Another set of metrics that would be useful are non-functional metrics. You can mention these to the interviewer to show that you are thinking of all the possible ways to measure the benefit of a model.
[OPTIONAL] Architecture

The next step is to create a general architecture, some companies require you to draw the architecture. I do not usually see companies care about drawing out the architecture like in System Design interviews. Once you can talk about the flow of data from database/storage to serving the customer, most companies are statisfied.
Data collection (from what database/storage product) -> Data preprocessing (workflows) -> Modelling (one or multiple models on servers) -> serve (how will the user get this model output)
One decision you would have to make is whether the system would be real time or batch. With real time systems, the complexity of the system increases and we need to be aware of the lag time when our model is making predictions. On the other hand, batch systems are simpler to implement (you can pre-save many predictions) and allows more complex models, however, you can have issues with staleness.
Data

This is section and the next would be where you would probably spend most of the time in the interview and where the interviewer would be looking to see how you perform.
- First, identify the target variable and how you would collect and label it (if necessary)
- In the recommendations example, the target variable would be whether, historically, a user liked a product from the company. There are typically two ways we can collect this target value: implicitly or explicitly. An example of explicit target collection would be if we look at our logs and check whether someone bought a product – this means they liked the product enough to buy it. On the other hand, an implicit target collection would be if a user “saves for later” a product or a user views a product a certain number of times. Note that explicit data collection is usually the best way to collect the target variable for most cases. If you think you can find a way to collect the target variable implicitly, then have this discussion with your interviewer and then talk about the pros and cons of each of your implicit suggestions.
- Discuss features and possible feature crosses:
- Usually you can break up features into 3 categories:
- User: Age, gender, nationality, country, language, amount of friends they have, amount of purchases they made etc.
- Content: title of product, how many people have purchased this product, number of times it was favourited, date added to the website etc.
- Context: web browser used, login location, region, time of day, day of week, device, product clicked etc.
- Then we can talk about useful feature crosses.
- Usually you can break up features into 3 categories:
- Data preprocessing/ Feature Engineering:
- Processing our features: We might have many different types of features (e.g. numeric, categorical, text or even images or videos) and we should speak about how we would preprocess them before adding them to the model:
- Numeric:
- Normalization (min-max) scaling: shrinks our numeric values between 0 and 1. We would tend to use normalization when you know that the distribution of you data does not follow a Gaussian distribution The equation is \(\hat{X} = \frac{X – X_{min}}{X_{max} – X_{min}}\).
- Z-score scaling: the values are centered around the mean with unit standard deviation. This method is better if the data follows a Guassian distribution. The equation is \(\hat{X} = \frac{X – \mu}{\sigma}\) where \(\mu\) is the mean of the sample and \(\sigma\) is the standard deviation.
- Log transform: applies \(log(d)\) to every data point \(d\). This method is used mainly when the data is not Gaussian and this transformation makes the data more Gaussian.
- Categorical:
- Sometimes it might be appropriate to use label encoding, however, since we are converting our category to a number we sometimes get unwanted relationships like the colour red (if we converted it to 1) can be 5 times colour blue (if blue was converted to a 5).
- If a categorical value has a dozen or fewer values, you can use one hot encoding
- If there are more than a few values, then we can use embeddings to create a set number of dimensions for all our categories.
- Lastly, we can hash each of our categories into a values (e.g. red will get value 1 and green may also get assigned the value 1). This method may lead to collision, so we need to be sure we want to use this method.
- Sometimes there are only a few low frequency categories, if this is the case we can map those categories that appear only a handful of times in our data to a new category called “other”.
- Text:
- Tokenization: we split the sentence into words and remove punctuations like commas from words.
- Lower casing: sometimes we might want to lower case our entire corpus, however, there may be times we do not want to perform this operation (like if we want to know about entities like London or Barack Obama, these upper case letter contain relevant information). These complexities are all things you should talk to your interviewer about.
- Stop words removal: here we remove very commonly used words since they may not add significant information to the model. Again, this might not be wanted in certain domains like translating languages.
- Lemmatization: reduces a word its a root word in the respective language. E.g. caring becomes care.
- Embeddings: We can use predefined word embeddings like BERT or Word2Vec to convert from a word to a vector of values.
- Images:
- Image standardization: For machine learning models, we should have consistency amgonst our data and standardization scales each image to have the same height and width.
- Grayscale conversion: convert coloured images to black and white. This saves memory and many applications do not require the colour of the image to perform well. However, if the question you are asked needs colour then you should not perform this preprocessing step.
- Normalisation: just like for numeric values, we can scale all our pixels to be between 0 and 1 (sometimes between -1 and 1). This method ensures that the all images in our dataset contribute equally and thus preventing bias from certain high pixel images.
- Data Augmentation: this method makes alterations to our images to increase diversity and the number of images we have for training. Some augmentation techniques include flipping the image, cropping the image and rotating the image.
- Numeric:
- Another important data issue that we need to handle is missing values:
- We can drop the rows with missing data which is an easy method but we are loosing information in our dataset
- We can use imputation. For categorical feature we can substitute the missing value for the maximum/min/most popular occurred value. For numeric features can use the mean of the feature (the mean is sensitive to outliers), the median (it might not be as accurate as the mean) or we can create a model to impute these missing values however, this add complexity into our pipeline.
- A less popular option is to create a new feature with “1” or “0” if the value is not missing or not.
- Sometimes our data has outliers, you should ask your interviewer if there are outliers in the data, and if they say yes, the here are some methods you can use:
- Similar to missing values, we can drop these rows in our dataset.
- If applicable, we can use ML models that are not affected by outliers like Tree based models. This limits the type of ML models we can use but it allows us to use all our data.
- There is also the possibility to cap outliers to a certain value. This also allows us to keep all our data but it can affect the distribution of our data.
- For classification problems we might be in a situation where there is class imbalance and we must know the steps we can take to remedy this problem:
- Under-sampling: we ignore majority class examples so that we get a balanced dataset. This improves the run time and reduces storage because we remove datapoints, however, we can discard useful information and the sample chosen can be biased and we may not get a representative view of the population of the majority class.
- Over-sampling: we randomly replicate the minority class. This method ensures we use all our data so we do not loose potentially informative datapoints, however, if increases the chance of overfitting as we replicates the minority class thereby giving the model similar datapoints often.
- SMOTE (Synthetic Minority Oversampling Technique): analyze the feature space of the minority class and recreate similar examples using a nearest neighbours approach. Using this method we remove the problem of overfitting as well as there is not loss of informative datapoints. On the other hand, it is not very effective for high dimensional data.
- One of the last topics we should briefly mention is the need to have a proper train test split. For classification, we should have the same amount of the classes in the training as well as testing dataset. For time series problems, our training data should be earlier than our testing data.
- Processing our features: We might have many different types of features (e.g. numeric, categorical, text or even images or videos) and we should speak about how we would preprocess them before adding them to the model:
- Feature Selection:
- Filter Methods: these methods are less accurate than other but ten to be fast to compute so work well with large datasets. Some examples of these methods are analysis of variance (checks the means of two or more groups and determines if they are significantly different from each other), chi-square test (used for categorical features), fisher’s score (returns the ranks of the variables based on the fisher’ score) and correlation (measure linear dependency between two numeric features where good feature are highly correlated with the target variable).
- Wrapper Methods: These methods analyze all the features by either incrementally adding (forward feature selection) or removing (backward feature elimination) a feature which contributes the most or least to the model. They test almost all possible combinations so the computation cost is very high and a certain set of features that are optimal for one model might not be for another model, so if you want to use many models in you exploration phase, you need to repeat this method for each model.
- Embedded Methods: These are ML methods that automatically perform feature selection like L1 Lasso Regression, Random Forests or Neural Networks.
- Additional Considerations:
- Biases: Are we sampling from a large enough subset of demographics, if not maybe we can group the largest and set others to be OOV demographics.
- Any concerns with privacy/laws? We may need to anonymize or remove data depending on privacy concerns.
Modelling

Once you have arrived at the modelling component, you should try to give a baseline model. Typically one that does not require machine learning. For example, a good baseline for our earlier prompt would be to recommend the most popular products to the users. This “model” will always be easy to implement and you have a baseline that all your other models should perform better than.
Then, speak about traditional ML models that are quick to train for e.g. logistic regression or decision trees. Once you discuss those, you can then talk about more complicated approaches like deep learning.
NOTE: do not forget to give the pros and cons of each approach you speak about. Example:
Model A:
- A short explanation of the model, the hyper-parameters and the loss function
- Pros of model A
- Cons of model A
I will give a quick cheat sheet for some popular models you may want to use in your interviews:
- Logistic regression
- Pros: Fast to train, quick inference, very compact, the predicted parameters can give feature importance, outputs probabilities.
- Cons: poor performance on non linear problems, assumes independent features but for high dimensional datasets this might not hold which would lead to overfitting (can use regularization at the expense of additional complexity), not very good at capturing very complex relationships.
- Loss function: Log Loss \(-{(y\log(y^\prime) + (1 – y)\log(1 – y^\prime))}\) where \(y\) is the label for that example and \(y^\prime\) is the predicted value.
- Gradient boosted trees (XGBoost):
- Pros: very good performance, data does not need to be scaled, handles missing values, gives feature importance and learns non-linear hypothesis function
- Cons: more prone to overfitting than random forest (reduces bias more than variance), lots of hyperparameters to rune, harder to scale up than random forests as tress built sequentially.
- Loss Function: Can use many loss functions (regression or classification) see list of possible loss functions in the loss functions list below
- Deep Neural Networks: produces state of the art solutions, deals with non-linearities, requires lots of tuning and can require a lot of computing resources to train.
- Pros: models non-linear hypothesis function, state-of-the-art results, feature engineering not necessary, scalability on large datasets as it supports parallel and distributed modes
- Cons: they are black boxes (hard to understand the reason for the model output) and requires more processing power for larger models and requires a large amount of data and tuning.
- Loss Function: Similar to boosted tress, they can use a number of loss functions depending on the problem (classification or regression).
Below we list some popular loss functions:
- [Regression] Mean Squared Error: \(\sum_{i=1}^{n}(x_i-y_i)^2\) The advantage is that we get a gradient descent with only one global minima and it penalizes the model for making larger errors because we are squaring the error (so not robust to outliers).
- [Regression]: Mean Absolute Error: \(\sum_{i=1}^{n}|x_i-y_i|\) This method is less sensitive towards outliers as they are not penalized as harshly but the modulus sign means that the equation is non-differentiable and will need optimizers like gradient descent to make them differentiable.
- [Classification] Cross Entropy for binary classes (log loss):\(-{(y\log(y^\prime) + (1 – y)\log(1 – y^\prime))}\)
- [Classification] Cross Entropy for multiple classes (softmax): \(-\sum_{c=1}^My_{o,c}\log(p_{o,c})\)
When talking about neural networks, you might want to mention activation functions. Some popular activation functions are:
- Sigmoid: \(f(x) = \frac{1}{1+ e^{-x}}\) the sigmoid nomralizes the output to a range between 0 and 1, which gives the probability of the input so it is used extensively in classification problems. The main disadvantage is that it suffers from saturation, (i.e. if it reaches 0 or 1), it’s derivative is 0 and so there will be no updates to the weights in a neural network for example (vanishing gradient).
- Relu: \(max(0, x)\), the relu is the most used as it is easy to compute, converges quickly and does not saturate. However, for negative values it returns 0 so is prone to saturation for negative inputs. This can be fixed by using leaky relu which adds a small value to negative numbers \(max(0.1x, x)\)
Explainability in Modeling
Now there might be times when you are required to build a model that is interpretable/explainable. Depending on the requirements you can talk about two types of model explainability:
- Models that provide interpretable outputs are preferred if explainability is a priority (e.g., linear models, decision trees). These models allow easy inspection to understand their decision patterns.
- If a complex model (e.g., neural network) is chosen, consider tools like SHAP or LIME to explain predictions to end users. These libraries help you understand the predictions of these complex models.
Serving
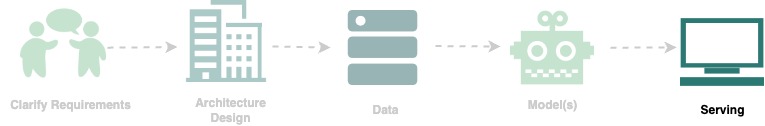
Now you have to serve the model to users, this is the last part of the interview.
Some points to mention:
- Online A/B testing
- Based on the online metrics we would select a significance level \(\alpha\) and power threshold 1 – \(\beta\)
- Calculate the required sample size per variation
- The required sample size depends on \(\alpha\), \(\beta\), and the MDE Minimum Detectable Effect – the target relative minimum increase over the baseline that should be observed from a test
- Randomly assign users into control and treatment groups (discuss with the interviewer whether we will split the candidates on the user level or the request level)
- Measure and analyze results using the appropriate test. Also, we should ensure that the model does not have any biases.
- If we are serving batch features they have to be handled offline and served at real time so we have to have daily/weekly jobs for generating this data.
- If we are serving real time features then they need to be fetched/derived at request time and we need to be aware of scalability or latency issues (load balancing), we may need to create a feature store to lookup features at serve time and maybe some caching depending on the use case.
- Monitoring Performance
- Latency (P99 latency every X minutes)
- Biases and misuses of your model.
- Performance Drop
- Data Drift
- CPU load
- Memory Usage
- Where to run inference: if we run the model on the user’s phone/computer then it would use their memory/battery but latency would be quick, on the other hand, if we store the model on our own service we increase latency and privacy concerns but removes the burden of taking up memory and battery on the user’s device.
- We should mention how often we would retrain the model. Some models need to be retrained every day, some every week and others monthly/yearly. Always discuss the pros and cons of the retraining regime you choose
Again, you should ask the interviewer if they would like you to explain how to productionize this serving component.